Differential gene expression across condition combinations#
In clinical data analysis, we often need to run differential expression (DE) across combinations of covariates: for example, comparing COVID-19 patients to healthy volunteers within each sex group to understand whether the transcriptional response to disease differs between men and women.
patpy makes this easy with ptc.ConditionComparison. It handles:
creating a combined condition label column
enumerating all (or a selected subset of) observed pairwise contrasts
running
model.compare_groups()for each pairconcatenating results with a
"contrast"columnstoring a fitted model instance per contrast for pertpy’s plotting API
We use the COMBAT COVID-19 cohort (PBMC from ~140 donors) as a real-world example, following the same pseudobulk pipeline as the pertpy DE tutorial.
Install#
pip install patpy pertpy pydeseq2
# For EdgeR (requires R):
pip install rpy2
# In R: BiocManager::install("edgeR")
Import packages#
import pertpy as pt
import scanpy as sc
import pandas as pd
import numpy as np
import anndata as ad
import matplotlib.pyplot as plt
import warnings

import patpy
import patpy.tl.condition_comparison as ptc

warnings.filterwarnings("ignore")
patpy.__version__
'0.12.1'
Load the COMBAT dataset#
The dataset contains 836k cells x 20,807 genes from ~140 PBMC donors spanning healthy volunteers (HV) and COVID-19 patients at various severity levels.
ADATA_PATH = "/home/icb/lucas.arnoldt/workspace/projects/patpy/COMBAT-CITESeq-DATA.h5ad"
adata = sc.read_h5ad(ADATA_PATH)
adata
AnnData object with n_obs × n_vars = 836148 × 20807
    obs: 'Annotation_cluster_id', 'Annotation_cluster_name', 'Annotation_minor_subset', 'Annotation_major_subset', 'Annotation_cell_type', 'GEX_region', 'QC_ngenes', 'QC_total_UMI', 'QC_pct_mitochondrial', 'QC_scrub_doublet_scores', 'TCR_chain_composition', 'TCR_clone_ID', 'TCR_clone_count', 'TCR_clone_proportion', 'TCR_contains_unproductive', 'TCR_doublet', 'TCR_chain_TRA', 'TCR_v_gene_TRA', 'TCR_d_gene_TRA', 'TCR_j_gene_TRA', 'TCR_c_gene_TRA', 'TCR_productive_TRA', 'TCR_cdr3_TRA', 'TCR_umis_TRA', 'TCR_chain_TRA2', 'TCR_v_gene_TRA2', 'TCR_d_gene_TRA2', 'TCR_j_gene_TRA2', 'TCR_c_gene_TRA2', 'TCR_productive_TRA2', 'TCR_cdr3_TRA2', 'TCR_umis_TRA2', 'TCR_chain_TRB', 'TCR_v_gene_TRB', 'TCR_d_gene_TRB', 'TCR_j_gene_TRB', 'TCR_c_gene_TRB', 'TCR_productive_TRB', 'TCR_chain_TRB2', 'TCR_v_gene_TRB2', 'TCR_d_gene_TRB2', 'TCR_j_gene_TRB2', 'TCR_c_gene_TRB2', 'TCR_productive_TRB2', 'TCR_cdr3_TRB2', 'TCR_umis_TRB2', 'BCR_umis_HC', 'BCR_contig_qc_HC', 'BCR_functionality_HC', 'BCR_v_call_HC', 'BCR_v_score_HC', 'BCR_j_call_HC', 'BCR_j_score_HC', 'BCR_junction_aa_HC', 'BCR_total_mut_HC', 'BCR_s_mut_HC', 'BCR_r_mut_HC', 'BCR_c_gene_HC', 'BCR_clone_per_replicate_HC', 'BCR_clone_global_HC', 'BCR_clonal_abundance_HC', 'BCR_locus_LC', 'BCR_umis_LC', 'BCR_contig_qc_LC', 'BCR_functionality_LC', 'BCR_v_call_LC', 'BCR_v_score_LC', 'BCR_j_call_LC', 'BCR_j_score_LC', 'BCR_junction_aa_LC', 'BCR_total_mut_LC', 'BCR_s_mut_LC', 'BCR_r_mut_LC', 'BCR_c_gene_LC', 'COMBAT_ID', 'scRNASeq_sample_ID', 'COMBAT_participant_timepoint_ID', 'Source', 'Age', 'Sex', 'Race', 'BMI', 'Hospitalstay', 'Death28', 'Institute', 'PreExistingHeartDisease', 'PreExistingLungDisease', 'PreExistingKidneyDisease', 'PreExistingDiabetes', 'PreExistingHypertension', 'PreExistingImmunocompromised', 'Smoking', 'Symptomatic', 'Requiredvasoactive', 'Respiratorysupport', 'SARSCoV2PCR', 'Outcome', 'TimeSinceOnset', 'Ethnicity', 'Tissue', 'DiseaseClassification', 'Pool_ID', 'Channel_ID'
    var: 'gene_ids', 'feature_types'
    uns: 'Institute', 'ObjectCreateDate', 'Source_colors', 'Technology', 'genome_annotation_version'
    obsm: 'X_umap', 'X_umap_source'
    layers: 'raw'
Set column names#
sample_id_col = "scRNASeq_sample_ID"       # per-donor identifier
cell_type_key = "Annotation_major_subset"  # broad cell type labels
source_col    = "Source"                   # COVID_SEV / HV
sex_col       = "Sex"                      # 0 = male, 1 = female
Quality control#
Remove donors with fewer than 100 cells.
adata = patpy.pp.filter_small_samples(
    adata, sample_key=sample_id_col, sample_size_threshold=100
)
print(f"{adata.obs[sample_id_col].nunique()} donors after QC filtering")
adata.layers["raw"] = adata.layers["raw"].todense()
2 samples removed: G05092-Ja005E-PBCa, S00030-Ja003E-PBCa
138 donors after QC filtering
Subset to a manageable cohort#
We keep only COVID-19 patients and healthy volunteers and sample up to 20 donors per source so the analysis finishes quickly. Remove this cell to run on the full dataset.
# Restrict to Covid and HV sources only
adata = adata[adata.obs[source_col].isin(["COVID_SEV", "HV"])].copy()

# Recode Sex to readable labels
adata.obs[sex_col] = adata.obs[sex_col].map({0: "male", 1: "female"})

# Sample up to 20 donors per source so both groups are always present
rng = np.random.default_rng(42)
keep = []
for source, grp in adata.obs.groupby(source_col):
    donors = grp[sample_id_col].unique()
    sampled = rng.choice(donors, size=min(20, len(donors)), replace=False)
    keep.extend(sampled)

adata = adata[adata.obs[sample_id_col].isin(keep)].copy()

print(f"{adata.n_obs:,} cells | {adata.obs[sample_id_col].nunique()} donors")
adata.obs[[sample_id_col, source_col]].drop_duplicates()[source_col].value_counts()
214,842 cells | 30 donors
Source
COVID_SEV    20
HV           10
Name: count, dtype: int64
Create pseudobulk profiles#
DE models require integer counts aggregated at the donor level.
We use patpy.tl.Pseudobulk for aggregation and patpy.pp.extract_metadata
to build the donor-level obs DataFrame.
pb = patpy.tl.Pseudobulk(
    sample_key=sample_id_col,
    cell_group_key=cell_type_key,
    layer="raw",
)
pb.prepare_anndata(adata)
pb.calculate_distance_matrix(aggregate="sum")
print(f"sample_representation shape: {pb.sample_representation.shape}")
print(f"donors: {len(pb.samples)}")
sample_representation shape: (30, 20807)
donors: 30
# Build donor-level obs using patpy.pp.extract_metadata
donor_obs = patpy.pp.extract_metadata(
    adata, sample_key=sample_id_col, columns=[source_col, sex_col]
)
donor_obs
| Source | Sex | |
|---|---|---|
| scRNASeq_sample_ID | ||
| S00056-Ja003E-PBCa | COVID_SEV | male |
| H00067-Ha001E-PBGa | HV | male |
| S00028-Ja001E-PBCa | COVID_SEV | male |
| S00033-Ja001E-PBCa | COVID_SEV | female |
| H00054-Ha001E-PBGa | HV | female |
| S00078-Ja003E-PBCa | COVID_SEV | male |
| S00042-Ja003E-PBCa | COVID_SEV | male |
| H00085-Ha001E-PBGa | HV | male |
| S00056-Ja005E-PBCa | COVID_SEV | male |
| H00049-Ha001E-PBGa | HV | male |
| S00041-Ja001E-PBCa | COVID_SEV | female |
| S00005-Ja003E-PBCa | COVID_SEV | male |
| S00048-Ja005E-PBCa | COVID_SEV | female |
| H00058-Ha001E-PBGa | HV | male |
| S00037-Ja003E-PBCa | COVID_SEV | female |
| S00064-Ja005E-PBCa | COVID_SEV | female |
| S00033-Ja005E-PBCa | COVID_SEV | female |
| S00045-Ja005E-PBCa | COVID_SEV | female |
| H00072-Ha001E-PBGa | HV | male |
| H00052-Ha001E-PBGa | HV | female |
| S00106-Ja003E-PBCa | COVID_SEV | male |
| S00077-Ja005E-PBCa | COVID_SEV | male |
| H00070-Ha001E-PBGa | HV | female |
| S00052-Ja003E-PBCa | COVID_SEV | female |
| S00069-Ja005E-PBCa | COVID_SEV | female |
| H00053-Ha001E-PBGa | HV | male |
| S00053-Ja003E-PBCa | COVID_SEV | female |
| S00033-Ja003E-PBCa | COVID_SEV | female |
| H00064-Ha001E-PBGa | HV | female |
| S00048-Ja003E-PBCa | COVID_SEV | female |
pdata = pb.to_adata(metadata=donor_obs)
pdata.var = adata.var
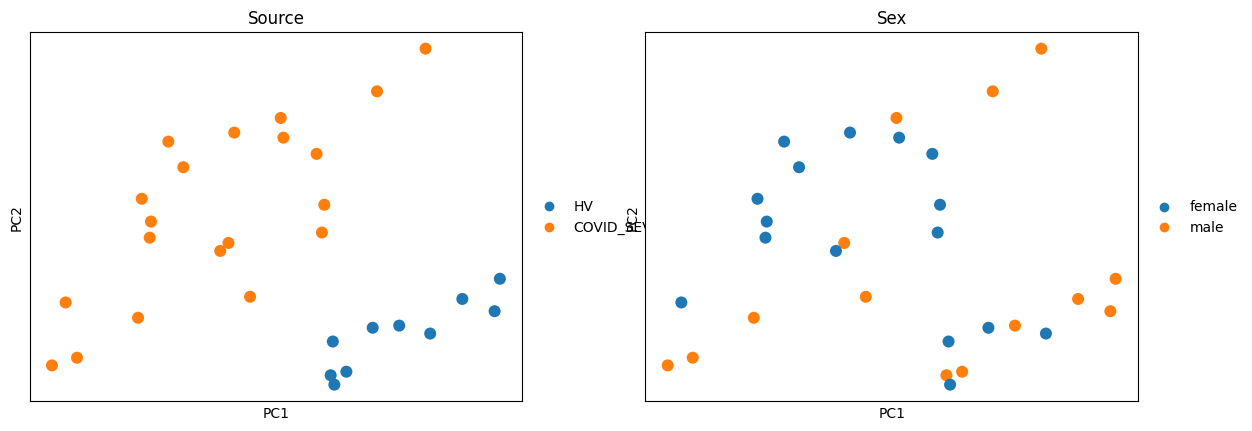
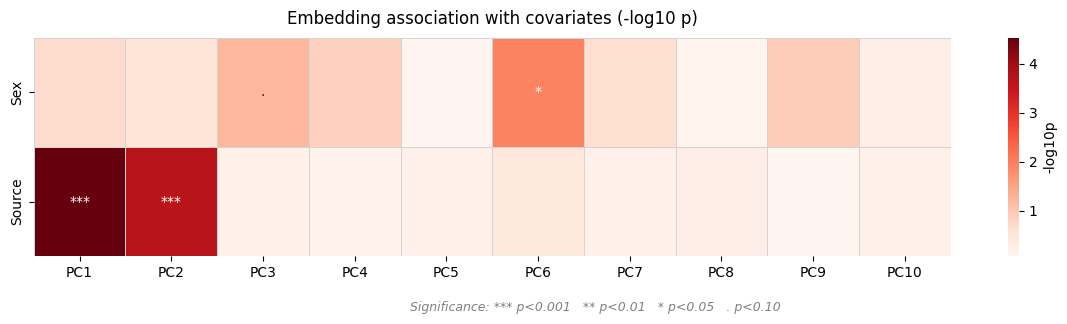
Explore axes of variation#
Before fitting any DE model it is useful to understand which covariates
drive variance in the pseudobulk profiles. We run PCA and use
patpy.tl.associate_embedding_with_covariates to test each PC against each
clinical variable, then visualise with patpy.pl.embedding_covariate_heatmap.
This guides the choice of design formula and which contrasts are worth testing.
pdata_pca = pdata.copy()
sc.pp.normalize_total(pdata_pca, target_sum=1e4)
sc.pp.log1p(pdata_pca)
sc.pp.scale(pdata_pca, max_value=10)
sc.pp.pca(pdata_pca)

# Copy PCA embedding back to pdata for downstream association test
pdata.obsm["X_pca"] = pdata_pca.obsm["X_pca"]

sc.pl.pca(pdata_pca, color=[source_col, sex_col], ncols=2, size=300)
# Test which PCs are driven by each clinical covariate
assoc = patpy.tl.associate_embedding_with_covariates(
    pdata,
    covariates=[source_col, sex_col],
    obsm_key="X_pca",
    n_components=10,
)

patpy.pl.embedding_covariate_heatmap(assoc)
Inspect the condition space#
ptc.build_condition_combinations lists every observed combination of
condition axes and ptc.build_all_pairwise_contrasts enumerates all pairs.
This is a quick sanity check before launching any model fits.
condition_cols = [source_col, sex_col]

combos = ptc.build_condition_combinations(pdata, condition_cols)
print(f"{len(combos)} observed condition combinations:")
combos
4 observed condition combinations:
| Source | Sex | label | |
|---|---|---|---|
| 0 | COVID_SEV | male | COVID_SEV_male |
| 1 | HV | male | HV_male |
| 2 | COVID_SEV | female | COVID_SEV_female |
| 3 | HV | female | HV_female |
contrasts = ptc.build_all_pairwise_contrasts(pdata, condition_cols)
print(f"{len(contrasts)} pairwise contrasts:")
for c in contrasts:
    print(f"  {c['label']}")
6 pairwise contrasts:
  COVID_SEV_male_vs_HV_male
  COVID_SEV_male_vs_COVID_SEV_female
  COVID_SEV_male_vs_HV_female
  HV_male_vs_COVID_SEV_female
  HV_male_vs_HV_female
  COVID_SEV_female_vs_HV_female
Differential expression — PyDESeq2#
In clinical data analysis, we often need to run DE for a combination of
covariates. patpy makes this easy with ptc.ConditionComparison. Let’s use
it to explore how the COVID-19 transcriptional response interacts with the sex
of patients.
run_once returns a (results_df, models) tuple. results_df is the tidy
DE table with a "contrast" column; models is a dict mapping each contrast
label to a model instance for pertpy’s plotting API.
res_deseq2, models_deseq2 = ptc.ConditionComparison.run_once(
    pt.tl.PyDESeq2,
    pdata,
    condition_cols=condition_cols,
)

print(f"{len(res_deseq2):,} DE results across {res_deseq2['contrast'].nunique()} contrasts")
print("Available contrasts:", list(models_deseq2))
res_deseq2.head()
Using None as control genes, passed at DeseqDataSet initialization
Log2 fold change & Wald test p-value, contrast vector: [ 0. -1.]
                     baseMean  log2FoldChange     lfcSE      stat    pvalue  \
OR4F5                0.000000             NaN       NaN       NaN       NaN
OR4F29               0.000000             NaN       NaN       NaN       NaN
OR4F16               0.000000             NaN       NaN       NaN       NaN
SAMD11               0.257261        0.638596  2.704208  0.236149  0.813317
NOC2L             1301.177247        0.094372  0.111198  0.848677  0.396061
...                       ...             ...       ...       ...       ...
AB_Podocalyxin   15319.067933        0.120656  0.180509  0.668418  0.503866
AB_CD224        205047.129847        0.497971  0.158971  3.132462  0.001733
AB_c_Met         43838.260224        0.078896  0.163130  0.483640  0.628642
AB_CD258_LIGHT   30073.626348        0.274918  0.196365  1.400034  0.161503
AB_DR3_TRAMP     54924.487941       -0.001373  0.150129 -0.009143  0.992705

                    padj
OR4F5                NaN
OR4F29               NaN
OR4F16               NaN
SAMD11               NaN
NOC2L           0.579510
...                  ...
AB_Podocalyxin  0.674455
AB_CD224        0.010756
AB_c_Met        0.771381
AB_CD258_LIGHT  0.322657
AB_DR3_TRAMP    0.995708

[20807 rows x 6 columns]
Using None as control genes, passed at DeseqDataSet initialization
Log2 fold change & Wald test p-value, contrast vector: [0. 1.]
                     baseMean  log2FoldChange     lfcSE      stat    pvalue  \
OR4F5                0.000000             NaN       NaN       NaN       NaN
OR4F29               0.000000             NaN       NaN       NaN       NaN
OR4F16               0.000000             NaN       NaN       NaN       NaN
SAMD11               0.475906       -1.105400  1.447396 -0.763717  0.445036
NOC2L             1105.555690        0.029394  0.085567  0.343515  0.731211
...                       ...             ...       ...       ...       ...
AB_Podocalyxin   12564.791412        0.146508  0.145149  1.009366  0.312799
AB_CD224        204842.505419       -0.100986  0.145320 -0.694922  0.487104
AB_c_Met         36280.451090        0.092051  0.134713  0.683313  0.494409
AB_CD258_LIGHT   25655.855243        0.153378  0.159897  0.959231  0.337442
AB_DR3_TRAMP     44420.734956        0.089644  0.123124  0.728077  0.466566

                    padj
OR4F5                NaN
OR4F29               NaN
OR4F16               NaN
SAMD11               NaN
NOC2L           0.933830
...                  ...
AB_Podocalyxin  0.749368
AB_CD224        0.846654
AB_c_Met        0.849794
AB_CD258_LIGHT  0.761958
AB_DR3_TRAMP    0.837508

[20807 rows x 6 columns]
Using None as control genes, passed at DeseqDataSet initialization
Log2 fold change & Wald test p-value, contrast vector: [ 0. -1.]
                     baseMean  log2FoldChange     lfcSE      stat    pvalue  \
OR4F5                0.000000             NaN       NaN       NaN       NaN
OR4F29               0.000000             NaN       NaN       NaN       NaN
OR4F16               0.000000             NaN       NaN       NaN       NaN
SAMD11               0.304920        0.413179  2.795188  0.147818  0.882486
NOC2L             1275.680812        0.094984  0.141383  0.671824  0.501696
...                       ...             ...       ...       ...       ...
AB_Podocalyxin   15661.234430       -0.046817  0.227499 -0.205790  0.836955
AB_CD224        220335.647664        0.167137  0.180218  0.927415  0.353711
AB_c_Met         44364.190769       -0.055211  0.201932 -0.273415  0.784534
AB_CD258_LIGHT   31169.337939        0.077529  0.240061  0.322956  0.746729
AB_DR3_TRAMP     54636.606110       -0.082354  0.184598 -0.446130  0.655504

                    padj
OR4F5                NaN
OR4F29               NaN
OR4F16               NaN
SAMD11               NaN
NOC2L           0.706560
...                  ...
AB_Podocalyxin  0.919111
AB_CD224        0.580670
AB_c_Met        0.892113
AB_CD258_LIGHT  0.869811
AB_DR3_TRAMP    0.814060

[20807 rows x 6 columns]
Using None as control genes, passed at DeseqDataSet initialization
Log2 fold change & Wald test p-value, contrast vector: [0. 1.]
                     baseMean  log2FoldChange     lfcSE      stat    pvalue  \
OR4F5                0.000000             NaN       NaN       NaN       NaN
OR4F29               0.000000             NaN       NaN       NaN       NaN
OR4F16               0.000000             NaN       NaN       NaN       NaN
SAMD11               0.452233       -1.724386  1.736218 -0.993186  0.320619
NOC2L             1172.035418       -0.046099  0.063806 -0.722486  0.469996
...                       ...             ...       ...       ...       ...
AB_Podocalyxin   13113.387053        0.036543  0.095558  0.382417  0.702152
AB_CD224        202108.034488       -0.584439  0.157110 -3.719934  0.000199
AB_c_Met         38371.188091        0.025135  0.101797  0.246911  0.804977
AB_CD258_LIGHT   25845.291369       -0.110884  0.109539 -1.012277  0.311406
AB_DR3_TRAMP     47898.678941        0.103565  0.102374  1.011631  0.311715

                    padj
OR4F5                NaN
OR4F29               NaN
OR4F16               NaN
SAMD11               NaN
NOC2L           0.588439
...                  ...
AB_Podocalyxin  0.788898
AB_CD224        0.000977
AB_c_Met        0.867582
AB_CD258_LIGHT  0.432657
AB_DR3_TRAMP    0.432967

[20807 rows x 6 columns]
Using None as control genes, passed at DeseqDataSet initialization
Log2 fold change & Wald test p-value, contrast vector: [0. 1.]
                     baseMean  log2FoldChange     lfcSE      stat    pvalue  \
OR4F5                0.000000             NaN       NaN       NaN       NaN
OR4F29               0.000000             NaN       NaN       NaN       NaN
OR4F16               0.000000             NaN       NaN       NaN       NaN
SAMD11               0.161094       -0.218150  3.429169 -0.063616  0.949276
NOC2L             1457.437279        0.008025  0.072268  0.111045  0.911581
...                       ...             ...       ...       ...       ...
AB_Podocalyxin   17811.995772       -0.162549  0.120624 -1.347573  0.177796
AB_CD224        212810.362686       -0.324465  0.170924 -1.898299  0.057657
AB_c_Met         51331.924318       -0.128705  0.114996 -1.119209  0.263051
AB_CD258_LIGHT   33068.168373       -0.192380  0.107632 -1.787390  0.073875
AB_DR3_TRAMP     65395.739182       -0.075470  0.112482 -0.670949  0.502253

                    padj
OR4F5                NaN
OR4F29               NaN
OR4F16               NaN
SAMD11               NaN
NOC2L           0.985759
...                  ...
AB_Podocalyxin  0.753284
AB_CD224        0.559493
AB_c_Met        0.797923
AB_CD258_LIGHT  0.609126
AB_DR3_TRAMP    0.898360

[20807 rows x 6 columns]
Using None as control genes, passed at DeseqDataSet initialization
Log2 fold change & Wald test p-value, contrast vector: [ 0. -1.]
                     baseMean  log2FoldChange     lfcSE      stat    pvalue  \
OR4F5                0.000000             NaN       NaN       NaN       NaN
OR4F29               0.000000             NaN       NaN       NaN       NaN
OR4F16               0.000000             NaN       NaN       NaN       NaN
SAMD11               0.501578        1.498871  1.903771  0.787317  0.431096
NOC2L             1140.414076        0.052733  0.084487  0.624154  0.532527
...                       ...             ...       ...       ...       ...
AB_Podocalyxin   13100.698970       -0.201278  0.120307 -1.673042  0.094319
AB_CD224        211821.629447        0.255880  0.180603  1.416811  0.156538
AB_c_Met         38107.199532       -0.156263  0.121557 -1.285508  0.198615
AB_CD258_LIGHT   26119.231594       -0.084049  0.129068 -0.651197  0.514919
AB_DR3_TRAMP     46912.388948       -0.181463  0.121083 -1.498663  0.133961

                    padj
OR4F5                NaN
OR4F29               NaN
OR4F16               NaN
SAMD11               NaN
NOC2L           0.682670
...                  ...
AB_Podocalyxin  0.207273
AB_CD224        0.297588
AB_c_Met        0.351425
AB_CD258_LIGHT  0.668215
AB_DR3_TRAMP    0.267058

[20807 rows x 6 columns]
124,842 DE results across 6 contrasts
Available contrasts: ['COVID_SEV_male_vs_HV_male', 'COVID_SEV_male_vs_COVID_SEV_female', 'COVID_SEV_male_vs_HV_female', 'HV_male_vs_COVID_SEV_female', 'HV_male_vs_HV_female', 'COVID_SEV_female_vs_HV_female']
| variable | baseMean | log_fc | lfcSE | stat | p_value | adj_p_value | contrast | |
|---|---|---|---|---|---|---|---|---|
| 0 | ZNF230 | 138.987101 | -1.575528 | 0.147200 | -10.703326 | 9.818907e-27 | 1.443870e-22 | COVID_SEV_male_vs_HV_male |
| 1 | TNFSF14 | 328.762813 | -1.947968 | 0.184911 | -10.534641 | 5.981085e-26 | 4.397593e-22 | COVID_SEV_male_vs_HV_male |
| 2 | CDCA5 | 236.643742 | 3.006126 | 0.309581 | 9.710300 | 2.725329e-22 | 1.335865e-18 | COVID_SEV_male_vs_HV_male |
| 3 | METTL18 | 399.540801 | -1.138663 | 0.118743 | -9.589296 | 8.868817e-22 | 3.260399e-18 | COVID_SEV_male_vs_HV_male |
| 4 | ID3 | 546.295056 | -2.568833 | 0.269282 | -9.539555 | 1.434469e-21 | 4.218774e-18 | COVID_SEV_male_vs_HV_male |
Differential expression - EdgeR#
Switch to EdgeR by changing a single argument. Everything else is identical.
EdgeR requires R with the edgeR Bioconductor package installed.
res_edger, models_edger = ptc.ConditionComparison.run_once(
    pt.tl.EdgeR,
    pdata,
    condition_cols=condition_cols,
)

print(f"{len(res_edger):,} DE results across {res_edger['contrast'].nunique()} contrasts")
res_edger.head()
• Calculating NormFactors
• Estimating Dispersions
• Fitting linear model
• Calculating NormFactors
• Estimating Dispersions
• Fitting linear model
• Calculating NormFactors
• Estimating Dispersions
• Fitting linear model
• Calculating NormFactors
• Estimating Dispersions
• Fitting linear model
• Calculating NormFactors
• Estimating Dispersions
• Fitting linear model
• Calculating NormFactors
• Estimating Dispersions
• Fitting linear model
124,842 DE results across 6 contrasts
| variable | log_fc | logCPM | F | p_value | adj_p_value | contrast | |
|---|---|---|---|---|---|---|---|
| 0 | ZNF230 | -1.597952 | 1.332414 | 118.189063 | 9.179426e-09 | 0.00010 | COVID_SEV_male_vs_HV_male |
| 1 | TNFSF14 | -1.966533 | 2.558231 | 117.450233 | 9.567627e-09 | 0.00010 | COVID_SEV_male_vs_HV_male |
| 2 | KIRREL3 | -3.524165 | -2.683243 | 68.893660 | 1.792087e-08 | 0.00011 | COVID_SEV_male_vs_HV_male |
| 3 | S1PR1 | -1.521756 | 5.490698 | 102.687991 | 2.445235e-08 | 0.00011 | COVID_SEV_male_vs_HV_male |
| 4 | ID3 | -2.589889 | 3.292700 | 101.491364 | 2.654054e-08 | 0.00011 | COVID_SEV_male_vs_HV_male |
Reuse settings with ConditionComparison#
ConditionComparison stores the model class and default kwargs so you can
run the same setup across multiple condition axes without repeating yourself.
After each run() call, model instances are stored in cc.models_ and
accessible via the named plot wrappers (plot_volcano, plot_fold_change,
plot_multicomparison_fc) or cc.get_model(contrast_label) for full control.
cc = ptc.ConditionComparison(pt.tl.PyDESeq2)
cc
ConditionComparison(PyDESeq2, )
# All pairwise combinations of Source x Sex
res_source_sex = cc.run(pdata, condition_cols=[source_col, sex_col])

# Source alone — the primary biological axis from the original COMBAT paper
res_source = cc.run(pdata, condition_cols=[source_col])

print("Source x Sex contrasts:", res_source_sex["contrast"].unique().tolist())
print("Source-only contrasts: ", res_source["contrast"].unique().tolist())
print("All stored models:", list(cc.models_))
cc  # repr shows model count after run
Using None as control genes, passed at DeseqDataSet initialization
Log2 fold change & Wald test p-value, contrast vector: [ 0. -1.]
                     baseMean  log2FoldChange     lfcSE      stat    pvalue  \
OR4F5                0.000000             NaN       NaN       NaN       NaN
OR4F29               0.000000             NaN       NaN       NaN       NaN
OR4F16               0.000000             NaN       NaN       NaN       NaN
SAMD11               0.257261        0.638596  2.704208  0.236149  0.813317
NOC2L             1301.177247        0.094372  0.111198  0.848677  0.396061
...                       ...             ...       ...       ...       ...
AB_Podocalyxin   15319.067933        0.120656  0.180509  0.668418  0.503866
AB_CD224        205047.129847        0.497971  0.158971  3.132462  0.001733
AB_c_Met         43838.260224        0.078896  0.163130  0.483640  0.628642
AB_CD258_LIGHT   30073.626348        0.274918  0.196365  1.400034  0.161503
AB_DR3_TRAMP     54924.487941       -0.001373  0.150129 -0.009143  0.992705

                    padj
OR4F5                NaN
OR4F29               NaN
OR4F16               NaN
SAMD11               NaN
NOC2L           0.579510
...                  ...
AB_Podocalyxin  0.674455
AB_CD224        0.010756
AB_c_Met        0.771381
AB_CD258_LIGHT  0.322657
AB_DR3_TRAMP    0.995708

[20807 rows x 6 columns]
Using None as control genes, passed at DeseqDataSet initialization
Log2 fold change & Wald test p-value, contrast vector: [0. 1.]
                     baseMean  log2FoldChange     lfcSE      stat    pvalue  \
OR4F5                0.000000             NaN       NaN       NaN       NaN
OR4F29               0.000000             NaN       NaN       NaN       NaN
OR4F16               0.000000             NaN       NaN       NaN       NaN
SAMD11               0.475906       -1.105400  1.447396 -0.763717  0.445036
NOC2L             1105.555690        0.029394  0.085567  0.343515  0.731211
...                       ...             ...       ...       ...       ...
AB_Podocalyxin   12564.791412        0.146508  0.145149  1.009366  0.312799
AB_CD224        204842.505419       -0.100986  0.145320 -0.694922  0.487104
AB_c_Met         36280.451090        0.092051  0.134713  0.683313  0.494409
AB_CD258_LIGHT   25655.855243        0.153378  0.159897  0.959231  0.337442
AB_DR3_TRAMP     44420.734956        0.089644  0.123124  0.728077  0.466566

                    padj
OR4F5                NaN
OR4F29               NaN
OR4F16               NaN
SAMD11               NaN
NOC2L           0.933830
...                  ...
AB_Podocalyxin  0.749368
AB_CD224        0.846654
AB_c_Met        0.849794
AB_CD258_LIGHT  0.761958
AB_DR3_TRAMP    0.837508

[20807 rows x 6 columns]
Using None as control genes, passed at DeseqDataSet initialization
Log2 fold change & Wald test p-value, contrast vector: [ 0. -1.]
                     baseMean  log2FoldChange     lfcSE      stat    pvalue  \
OR4F5                0.000000             NaN       NaN       NaN       NaN
OR4F29               0.000000             NaN       NaN       NaN       NaN
OR4F16               0.000000             NaN       NaN       NaN       NaN
SAMD11               0.304920        0.413179  2.795188  0.147818  0.882486
NOC2L             1275.680812        0.094984  0.141383  0.671824  0.501696
...                       ...             ...       ...       ...       ...
AB_Podocalyxin   15661.234430       -0.046817  0.227499 -0.205790  0.836955
AB_CD224        220335.647664        0.167137  0.180218  0.927415  0.353711
AB_c_Met         44364.190769       -0.055211  0.201932 -0.273415  0.784534
AB_CD258_LIGHT   31169.337939        0.077529  0.240061  0.322956  0.746729
AB_DR3_TRAMP     54636.606110       -0.082354  0.184598 -0.446130  0.655504

                    padj
OR4F5                NaN
OR4F29               NaN
OR4F16               NaN
SAMD11               NaN
NOC2L           0.706560
...                  ...
AB_Podocalyxin  0.919111
AB_CD224        0.580670
AB_c_Met        0.892113
AB_CD258_LIGHT  0.869811
AB_DR3_TRAMP    0.814060

[20807 rows x 6 columns]
Using None as control genes, passed at DeseqDataSet initialization
Log2 fold change & Wald test p-value, contrast vector: [0. 1.]
                     baseMean  log2FoldChange     lfcSE      stat    pvalue  \
OR4F5                0.000000             NaN       NaN       NaN       NaN
OR4F29               0.000000             NaN       NaN       NaN       NaN
OR4F16               0.000000             NaN       NaN       NaN       NaN
SAMD11               0.452233       -1.724386  1.736218 -0.993186  0.320619
NOC2L             1172.035418       -0.046099  0.063806 -0.722486  0.469996
...                       ...             ...       ...       ...       ...
AB_Podocalyxin   13113.387053        0.036543  0.095558  0.382417  0.702152
AB_CD224        202108.034488       -0.584439  0.157110 -3.719934  0.000199
AB_c_Met         38371.188091        0.025135  0.101797  0.246911  0.804977
AB_CD258_LIGHT   25845.291369       -0.110884  0.109539 -1.012277  0.311406
AB_DR3_TRAMP     47898.678941        0.103565  0.102374  1.011631  0.311715

                    padj
OR4F5                NaN
OR4F29               NaN
OR4F16               NaN
SAMD11               NaN
NOC2L           0.588439
...                  ...
AB_Podocalyxin  0.788898
AB_CD224        0.000977
AB_c_Met        0.867582
AB_CD258_LIGHT  0.432657
AB_DR3_TRAMP    0.432967

[20807 rows x 6 columns]
Using None as control genes, passed at DeseqDataSet initialization
Log2 fold change & Wald test p-value, contrast vector: [0. 1.]
                     baseMean  log2FoldChange     lfcSE      stat    pvalue  \
OR4F5                0.000000             NaN       NaN       NaN       NaN
OR4F29               0.000000             NaN       NaN       NaN       NaN
OR4F16               0.000000             NaN       NaN       NaN       NaN
SAMD11               0.161094       -0.218150  3.429169 -0.063616  0.949276
NOC2L             1457.437279        0.008025  0.072268  0.111045  0.911581
...                       ...             ...       ...       ...       ...
AB_Podocalyxin   17811.995772       -0.162549  0.120624 -1.347573  0.177796
AB_CD224        212810.362686       -0.324465  0.170924 -1.898299  0.057657
AB_c_Met         51331.924318       -0.128705  0.114996 -1.119209  0.263051
AB_CD258_LIGHT   33068.168373       -0.192380  0.107632 -1.787390  0.073875
AB_DR3_TRAMP     65395.739182       -0.075470  0.112482 -0.670949  0.502253

                    padj
OR4F5                NaN
OR4F29               NaN
OR4F16               NaN
SAMD11               NaN
NOC2L           0.985759
...                  ...
AB_Podocalyxin  0.753284
AB_CD224        0.559493
AB_c_Met        0.797923
AB_CD258_LIGHT  0.609126
AB_DR3_TRAMP    0.898360

[20807 rows x 6 columns]
Using None as control genes, passed at DeseqDataSet initialization
Log2 fold change & Wald test p-value, contrast vector: [ 0. -1.]
                     baseMean  log2FoldChange     lfcSE      stat    pvalue  \
OR4F5                0.000000             NaN       NaN       NaN       NaN
OR4F29               0.000000             NaN       NaN       NaN       NaN
OR4F16               0.000000             NaN       NaN       NaN       NaN
SAMD11               0.501578        1.498871  1.903771  0.787317  0.431096
NOC2L             1140.414076        0.052733  0.084487  0.624154  0.532527
...                       ...             ...       ...       ...       ...
AB_Podocalyxin   13100.698970       -0.201278  0.120307 -1.673042  0.094319
AB_CD224        211821.629447        0.255880  0.180603  1.416811  0.156538
AB_c_Met         38107.199532       -0.156263  0.121557 -1.285508  0.198615
AB_CD258_LIGHT   26119.231594       -0.084049  0.129068 -0.651197  0.514919
AB_DR3_TRAMP     46912.388948       -0.181463  0.121083 -1.498663  0.133961

                    padj
OR4F5                NaN
OR4F29               NaN
OR4F16               NaN
SAMD11               NaN
NOC2L           0.682670
...                  ...
AB_Podocalyxin  0.207273
AB_CD224        0.297588
AB_c_Met        0.351425
AB_CD258_LIGHT  0.668215
AB_DR3_TRAMP    0.267058

[20807 rows x 6 columns]
Using None as control genes, passed at DeseqDataSet initialization
Log2 fold change & Wald test p-value, contrast vector: [ 0. -1.]
                     baseMean  log2FoldChange     lfcSE      stat    pvalue  \
OR4F5                0.000000             NaN       NaN       NaN       NaN
OR4F29               0.000000             NaN       NaN       NaN       NaN
OR4F16               0.000000             NaN       NaN       NaN       NaN
SAMD11               0.396043        1.248338  1.305570  0.956163  0.338990
NOC2L             1212.810770        0.067816  0.061259  1.107030  0.268281
...                       ...             ...       ...       ...       ...
AB_Podocalyxin   14104.676718       -0.039824  0.107165 -0.371613  0.710181
AB_CD224        209277.179155        0.409534  0.120222  3.406467  0.000658
AB_c_Met         40707.871349       -0.036795  0.098071 -0.375191  0.707518
AB_CD258_LIGHT   27915.251432        0.097523  0.116619  0.836254  0.403012
AB_DR3_TRAMP     50528.479383       -0.093938  0.091834 -1.022908  0.306351

                    padj
OR4F5                NaN
OR4F29               NaN
OR4F16               NaN
SAMD11               NaN
NOC2L           0.389903
...                  ...
AB_Podocalyxin  0.793303
AB_CD224        0.002596
AB_c_Met        0.791520
AB_CD258_LIGHT  0.528338
AB_DR3_TRAMP    0.431063

[20807 rows x 6 columns]
Source x Sex contrasts: ['COVID_SEV_male_vs_HV_male', 'COVID_SEV_male_vs_COVID_SEV_female', 'COVID_SEV_male_vs_HV_female', 'HV_male_vs_COVID_SEV_female', 'HV_male_vs_HV_female', 'COVID_SEV_female_vs_HV_female']
Source-only contrasts:  ['COVID_SEV_vs_HV']
All stored models: ['COVID_SEV_male_vs_HV_male', 'COVID_SEV_male_vs_COVID_SEV_female', 'COVID_SEV_male_vs_HV_female', 'HV_male_vs_COVID_SEV_female', 'HV_male_vs_HV_female', 'COVID_SEV_female_vs_HV_female', 'COVID_SEV_vs_HV']
ConditionComparison(PyDESeq2, ) [7 model(s): ['COVID_SEV_male_vs_HV_male', 'COVID_SEV_male_vs_COVID_SEV_female', 'COVID_SEV_male_vs_HV_female', 'HV_male_vs_COVID_SEV_female', 'HV_male_vs_HV_female', 'COVID_SEV_female_vs_HV_female', 'COVID_SEV_vs_HV']]
Restrict to biologically motivated contrasts#
Pass subset_contrasts to run only the comparisons you care about — here,
only contrasts that involve the healthy volunteer (HV) reference group.
With readable sex labels and four condition groups (COVID_SEV_female,
COVID_SEV_male, HV_female, HV_male), this gives us five interpretable
disease-vs-healthy comparisons.
all_contrasts = ptc.build_all_pairwise_contrasts(pdata, condition_cols)

vs_hv = [c for c in all_contrasts if "HV" in c["group"] or "HV" in c["baseline"]]
print("Contrasts vs HV:", [c["label"] for c in vs_hv])

res_vs_hv, models_vs_hv = ptc.ConditionComparison.run_once(
    pt.tl.PyDESeq2,
    pdata,
    condition_cols=condition_cols,
    subset_contrasts=vs_hv,
)
res_vs_hv["contrast"].unique()
Contrasts vs HV: ['COVID_SEV_male_vs_HV_male', 'COVID_SEV_male_vs_HV_female', 'HV_male_vs_COVID_SEV_female', 'HV_male_vs_HV_female', 'COVID_SEV_female_vs_HV_female']
Using None as control genes, passed at DeseqDataSet initialization
Log2 fold change & Wald test p-value, contrast vector: [ 0. -1.]
                     baseMean  log2FoldChange     lfcSE      stat    pvalue  \
OR4F5                0.000000             NaN       NaN       NaN       NaN
OR4F29               0.000000             NaN       NaN       NaN       NaN
OR4F16               0.000000             NaN       NaN       NaN       NaN
SAMD11               0.257261        0.638596  2.704208  0.236149  0.813317
NOC2L             1301.177247        0.094372  0.111198  0.848677  0.396061
...                       ...             ...       ...       ...       ...
AB_Podocalyxin   15319.067933        0.120656  0.180509  0.668418  0.503866
AB_CD224        205047.129847        0.497971  0.158971  3.132462  0.001733
AB_c_Met         43838.260224        0.078896  0.163130  0.483640  0.628642
AB_CD258_LIGHT   30073.626348        0.274918  0.196365  1.400034  0.161503
AB_DR3_TRAMP     54924.487941       -0.001373  0.150129 -0.009143  0.992705

                    padj
OR4F5                NaN
OR4F29               NaN
OR4F16               NaN
SAMD11               NaN
NOC2L           0.579510
...                  ...
AB_Podocalyxin  0.674455
AB_CD224        0.010756
AB_c_Met        0.771381
AB_CD258_LIGHT  0.322657
AB_DR3_TRAMP    0.995708

[20807 rows x 6 columns]
Using None as control genes, passed at DeseqDataSet initialization
Log2 fold change & Wald test p-value, contrast vector: [ 0. -1.]
                     baseMean  log2FoldChange     lfcSE      stat    pvalue  \
OR4F5                0.000000             NaN       NaN       NaN       NaN
OR4F29               0.000000             NaN       NaN       NaN       NaN
OR4F16               0.000000             NaN       NaN       NaN       NaN
SAMD11               0.304920        0.413179  2.795188  0.147818  0.882486
NOC2L             1275.680812        0.094984  0.141383  0.671824  0.501696
...                       ...             ...       ...       ...       ...
AB_Podocalyxin   15661.234430       -0.046817  0.227499 -0.205790  0.836955
AB_CD224        220335.647664        0.167137  0.180218  0.927415  0.353711
AB_c_Met         44364.190769       -0.055211  0.201932 -0.273415  0.784534
AB_CD258_LIGHT   31169.337939        0.077529  0.240061  0.322956  0.746729
AB_DR3_TRAMP     54636.606110       -0.082354  0.184598 -0.446130  0.655504

                    padj
OR4F5                NaN
OR4F29               NaN
OR4F16               NaN
SAMD11               NaN
NOC2L           0.706560
...                  ...
AB_Podocalyxin  0.919111
AB_CD224        0.580670
AB_c_Met        0.892113
AB_CD258_LIGHT  0.869811
AB_DR3_TRAMP    0.814060

[20807 rows x 6 columns]
Using None as control genes, passed at DeseqDataSet initialization
Log2 fold change & Wald test p-value, contrast vector: [0. 1.]
                     baseMean  log2FoldChange     lfcSE      stat    pvalue  \
OR4F5                0.000000             NaN       NaN       NaN       NaN
OR4F29               0.000000             NaN       NaN       NaN       NaN
OR4F16               0.000000             NaN       NaN       NaN       NaN
SAMD11               0.452233       -1.724386  1.736218 -0.993186  0.320619
NOC2L             1172.035418       -0.046099  0.063806 -0.722486  0.469996
...                       ...             ...       ...       ...       ...
AB_Podocalyxin   13113.387053        0.036543  0.095558  0.382417  0.702152
AB_CD224        202108.034488       -0.584439  0.157110 -3.719934  0.000199
AB_c_Met         38371.188091        0.025135  0.101797  0.246911  0.804977
AB_CD258_LIGHT   25845.291369       -0.110884  0.109539 -1.012277  0.311406
AB_DR3_TRAMP     47898.678941        0.103565  0.102374  1.011631  0.311715

                    padj
OR4F5                NaN
OR4F29               NaN
OR4F16               NaN
SAMD11               NaN
NOC2L           0.588439
...                  ...
AB_Podocalyxin  0.788898
AB_CD224        0.000977
AB_c_Met        0.867582
AB_CD258_LIGHT  0.432657
AB_DR3_TRAMP    0.432967

[20807 rows x 6 columns]
Using None as control genes, passed at DeseqDataSet initialization
Log2 fold change & Wald test p-value, contrast vector: [0. 1.]
                     baseMean  log2FoldChange     lfcSE      stat    pvalue  \
OR4F5                0.000000             NaN       NaN       NaN       NaN
OR4F29               0.000000             NaN       NaN       NaN       NaN
OR4F16               0.000000             NaN       NaN       NaN       NaN
SAMD11               0.161094       -0.218150  3.429169 -0.063616  0.949276
NOC2L             1457.437279        0.008025  0.072268  0.111045  0.911581
...                       ...             ...       ...       ...       ...
AB_Podocalyxin   17811.995772       -0.162549  0.120624 -1.347573  0.177796
AB_CD224        212810.362686       -0.324465  0.170924 -1.898299  0.057657
AB_c_Met         51331.924318       -0.128705  0.114996 -1.119209  0.263051
AB_CD258_LIGHT   33068.168373       -0.192380  0.107632 -1.787390  0.073875
AB_DR3_TRAMP     65395.739182       -0.075470  0.112482 -0.670949  0.502253

                    padj
OR4F5                NaN
OR4F29               NaN
OR4F16               NaN
SAMD11               NaN
NOC2L           0.985759
...                  ...
AB_Podocalyxin  0.753284
AB_CD224        0.559493
AB_c_Met        0.797923
AB_CD258_LIGHT  0.609126
AB_DR3_TRAMP    0.898360

[20807 rows x 6 columns]
Using None as control genes, passed at DeseqDataSet initialization
Log2 fold change & Wald test p-value, contrast vector: [ 0. -1.]
                     baseMean  log2FoldChange     lfcSE      stat    pvalue  \
OR4F5                0.000000             NaN       NaN       NaN       NaN
OR4F29               0.000000             NaN       NaN       NaN       NaN
OR4F16               0.000000             NaN       NaN       NaN       NaN
SAMD11               0.501578        1.498871  1.903771  0.787317  0.431096
NOC2L             1140.414076        0.052733  0.084487  0.624154  0.532527
...                       ...             ...       ...       ...       ...
AB_Podocalyxin   13100.698970       -0.201278  0.120307 -1.673042  0.094319
AB_CD224        211821.629447        0.255880  0.180603  1.416811  0.156538
AB_c_Met         38107.199532       -0.156263  0.121557 -1.285508  0.198615
AB_CD258_LIGHT   26119.231594       -0.084049  0.129068 -0.651197  0.514919
AB_DR3_TRAMP     46912.388948       -0.181463  0.121083 -1.498663  0.133961

                    padj
OR4F5                NaN
OR4F29               NaN
OR4F16               NaN
SAMD11               NaN
NOC2L           0.682670
...                  ...
AB_Podocalyxin  0.207273
AB_CD224        0.297588
AB_c_Met        0.351425
AB_CD258_LIGHT  0.668215
AB_DR3_TRAMP    0.267058

[20807 rows x 6 columns]
array(['COVID_SEV_male_vs_HV_male', 'COVID_SEV_male_vs_HV_female',
       'HV_male_vs_COVID_SEV_female', 'HV_male_vs_HV_female',
       'COVID_SEV_female_vs_HV_female'], dtype=object)
Inspect and visualise results#
How many genes are differentially expressed per contrast?#
We first look at the number of DE genes (FDR < 0.05) per contrast to get a sense of which comparisons are most informative.
# Number of significant genes per contrast (FDR < 0.05)
sig = res_deseq2[res_deseq2["adj_p_value"] < 0.05]
n_sig = (
    sig.groupby("contrast")["variable"]
    .count()
    .rename("n_sig_genes")
    .sort_values(ascending=False)
)
print(n_sig.to_string())
contrast
HV_male_vs_COVID_SEV_female           6316
COVID_SEV_female_vs_HV_female         4135
COVID_SEV_male_vs_HV_male             3641
COVID_SEV_male_vs_HV_female           2377
COVID_SEV_male_vs_COVID_SEV_female     231
HV_male_vs_HV_female                    70
The contrast with the most DE genes is HV_male_vs_COVID_SEV_female. This is expected: it conflates
two orthogonal biological signals (disease status and sex) so genes
driving both effects are captured simultaneously. The contrast with the
fewest DE genes (HV_male_vs_HV_female) reflects pure
sex differences in healthy individuals.
Most interesting are the within-sex disease comparisons
(COVID_SEV_female_vs_HV_female and COVID_SEV_male_vs_HV_male): comparing
their DE gene counts tells us whether the transcriptional response to COVID-19
is stronger in one sex than the other.
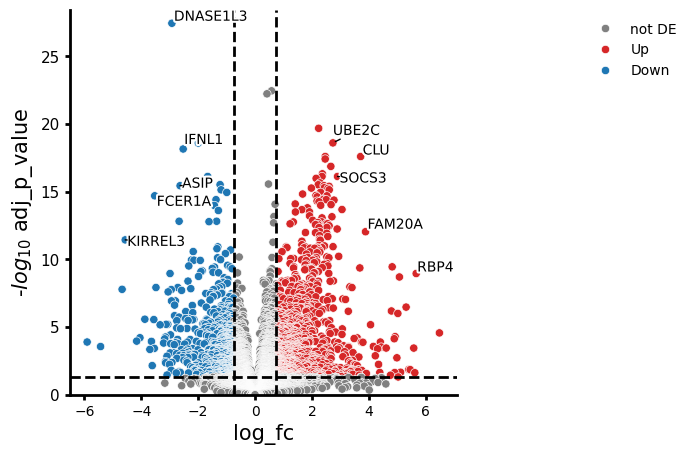
Volcano plots: COVID-19 response within each sex#
We visualise the two within-sex disease contrasts side-by-side. If the response is sex-dimorphic, we expect different genes or different effect sizes between the two plots.
# COVID in females vs healthy females
cc.plot_volcano("COVID_SEV_female_vs_HV_female", results_df=res_source_sex)
NaNs encountered, dropping rows with NaNs
# COVID in males vs healthy males
cc.plot_volcano("COVID_SEV_male_vs_HV_male", results_df=res_source_sex)
NaNs encountered, dropping rows with NaNs
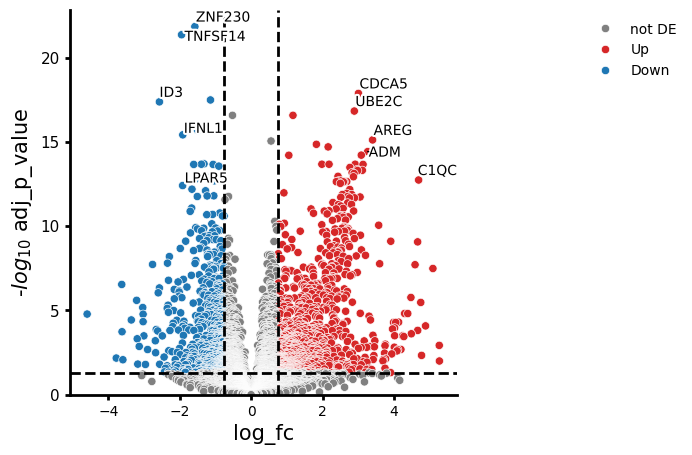
Comparing the two volcano plots, we can see whether men or women show a stronger or qualitatively different transcriptional response to severe COVID-19. Top hits appearing in both contrasts represent a robust, sex-independent COVID-19 signature; hits unique to one contrast suggest sex-dimorphic regulation.
Top DE genes across all contrasts#
# Top DE genes across all contrasts (FDR < 0.05, ranked by |log2FC|)
(
    sig
    .assign(abs_lfc=sig["log_fc"].abs())
    .sort_values("abs_lfc", ascending=False)
    [["variable", "log_fc", "adj_p_value", "contrast"]]
    .drop_duplicates(subset="variable")
    .head(20)
)
| variable | log_fc | adj_p_value | contrast | |
|---|---|---|---|---|
| 62669 | NLGN4Y | 6.938495 | 9.139796e-13 | HV_male_vs_COVID_SEV_female |
| 104790 | IGHV7-4-1 | 6.479591 | 2.700344e-05 | COVID_SEV_female_vs_HV_female |
| 41625 | PPP1R2C | -6.109462 | 5.559397e-16 | COVID_SEV_male_vs_HV_female |
| 63686 | IGHV2-70D | -6.057814 | 2.458839e-06 | HV_male_vs_COVID_SEV_female |
| 63105 | MT1M | -5.979759 | 1.507049e-08 | HV_male_vs_COVID_SEV_female |
| 42879 | RPS4Y2 | 5.934048 | 8.287526e-03 | COVID_SEV_male_vs_HV_female |
| 41889 | IGLV1-36 | -5.910407 | 1.064951e-05 | COVID_SEV_male_vs_HV_female |
| 105075 | NEBL | -5.901076 | 1.273689e-04 | COVID_SEV_female_vs_HV_female |
| 42196 | CH25H | 5.745514 | 3.765922e-04 | COVID_SEV_male_vs_HV_female |
| 41754 | SCARA5 | -5.676529 | 2.323386e-07 | COVID_SEV_male_vs_HV_female |
| 83251 | IGHV3-72 | -5.676303 | 3.340620e-04 | HV_male_vs_HV_female |
| 104206 | RBP4 | 5.663338 | 1.104282e-09 | COVID_SEV_female_vs_HV_female |
| 107360 | IL22 | 5.615235 | 2.371759e-02 | COVID_SEV_female_vs_HV_female |
| 83228 | RPS4Y1 | 5.576503 | 0.000000e+00 | HV_male_vs_HV_female |
| 106927 | TNFAIP8L3 | 5.453919 | 1.403992e-02 | COVID_SEV_female_vs_HV_female |
| 105259 | NCKAP5 | -5.429160 | 2.752898e-04 | COVID_SEV_female_vs_HV_female |
| 106912 | MMP2 | 5.403471 | 1.366702e-02 | COVID_SEV_female_vs_HV_female |
| 104389 | KCTD14 | 5.308883 | 3.353649e-07 | COVID_SEV_female_vs_HV_female |
| 62535 | IFI27 | -5.305665 | 1.033737e-16 | HV_male_vs_COVID_SEV_female |
| 43859 | PDE3A | 5.288927 | 4.263431e-02 | COVID_SEV_male_vs_HV_female |