Statistical test for the distances between samples from case and control groups#
In this notebook, we will obtain a pseudobulk patient representation, and perform a statistical test of distances between samples similar to Petukhov et al.
Install patpy#
!pip install git+https://github.com/lueckenlab/patpy.git@main
Import packages#
import scanpy as sc
import patpy
patpy.__version__
'0.8.1'
Read the data#
I will use COMBAT dataset. You can set your own path. This is a dataset of PBMC (peripheral blood mococnuclear cells) from roughly 140 patients. There are different severity stages of COVID-19, healthy controls as well as some Flu and Sepsis patients. Can we detect differences between controls and patients? Let’s see!
ADATA_PATH = "/Users/vladimir.shitov/Documents/programming/pat_rep_benchmark/data/combat/combat_processed.h5ad"
adata = sc.read_h5ad(ADATA_PATH)
adata
AnnData object with n_obs × n_vars = 783677 × 3000
    obs: 'Annotation_cluster_id', 'Annotation_cluster_name', 'Annotation_minor_subset', 'Annotation_major_subset', 'Annotation_cell_type', 'GEX_region', 'QC_ngenes', 'QC_total_UMI', 'QC_pct_mitochondrial', 'QC_scrub_doublet_scores', 'TCR_chain_composition', 'TCR_clone_ID', 'TCR_clone_count', 'TCR_clone_proportion', 'TCR_contains_unproductive', 'TCR_doublet', 'TCR_chain_TRA', 'TCR_v_gene_TRA', 'TCR_d_gene_TRA', 'TCR_j_gene_TRA', 'TCR_c_gene_TRA', 'TCR_productive_TRA', 'TCR_cdr3_TRA', 'TCR_umis_TRA', 'TCR_chain_TRA2', 'TCR_v_gene_TRA2', 'TCR_d_gene_TRA2', 'TCR_j_gene_TRA2', 'TCR_c_gene_TRA2', 'TCR_productive_TRA2', 'TCR_cdr3_TRA2', 'TCR_umis_TRA2', 'TCR_chain_TRB', 'TCR_v_gene_TRB', 'TCR_d_gene_TRB', 'TCR_j_gene_TRB', 'TCR_c_gene_TRB', 'TCR_productive_TRB', 'TCR_chain_TRB2', 'TCR_v_gene_TRB2', 'TCR_d_gene_TRB2', 'TCR_j_gene_TRB2', 'TCR_c_gene_TRB2', 'TCR_productive_TRB2', 'TCR_cdr3_TRB2', 'TCR_umis_TRB2', 'BCR_umis_HC', 'BCR_contig_qc_HC', 'BCR_functionality_HC', 'BCR_v_call_HC', 'BCR_v_score_HC', 'BCR_j_call_HC', 'BCR_j_score_HC', 'BCR_junction_aa_HC', 'BCR_total_mut_HC', 'BCR_s_mut_HC', 'BCR_r_mut_HC', 'BCR_c_gene_HC', 'BCR_clone_per_replicate_HC', 'BCR_clone_global_HC', 'BCR_clonal_abundance_HC', 'BCR_locus_LC', 'BCR_umis_LC', 'BCR_contig_qc_LC', 'BCR_functionality_LC', 'BCR_v_call_LC', 'BCR_v_score_LC', 'BCR_j_call_LC', 'BCR_j_score_LC', 'BCR_junction_aa_LC', 'BCR_total_mut_LC', 'BCR_s_mut_LC', 'BCR_r_mut_LC', 'BCR_c_gene_LC', 'COMBAT_ID', 'scRNASeq_sample_ID', 'COMBAT_participant_timepoint_ID', 'Source', 'Age', 'Sex', 'Race', 'BMI', 'Hospitalstay', 'Death28', 'Institute', 'PreExistingHeartDisease', 'PreExistingLungDisease', 'PreExistingKidneyDisease', 'PreExistingDiabetes', 'PreExistingHypertension', 'PreExistingImmunocompromised', 'Smoking', 'Symptomatic', 'Requiredvasoactive', 'Respiratorysupport', 'SARSCoV2PCR', 'Outcome', 'TimeSinceOnset', 'Ethnicity', 'Tissue', 'DiseaseClassification', 'Pool_ID', 'Channel_ID', 'ifn_1_score', '_scvi_batch', '_scvi_labels', 'n_genes_by_counts', 'log1p_n_genes_by_counts', 'total_counts', 'log1p_total_counts', 'pct_counts_in_top_50_genes', 'pct_counts_in_top_100_genes', 'pct_counts_in_top_200_genes', 'pct_counts_in_top_500_genes', 'total_counts_mt', 'log1p_total_counts_mt', 'pct_counts_mt', 'total_counts_ribo', 'log1p_total_counts_ribo', 'pct_counts_ribo'
    var: 'gene_ids', 'feature_types', 'highly_variable', 'highly_variable_rank', 'means', 'variances', 'variances_norm', 'highly_variable_nbatches', 'mt', 'ribo', 'n_cells_by_counts', 'mean_counts', 'log1p_mean_counts', 'pct_dropout_by_counts', 'total_counts', 'log1p_total_counts'
    uns: 'Institute', 'ObjectCreateDate', 'Source_colors', 'Technology', 'X_scpoli', '_scvi_manager_uuid', '_scvi_uuid', 'genome_annotation_version', 'hvg', 'log1p', 'pca', 'scpoli_distances', 'scpoli_parameters', 'scpoli_samples'
    obsm: 'X_pca', 'X_scANVI_batch', 'X_scANVI_sample', 'X_scVI_batch', 'X_scVI_sample', 'X_scpoli', 'X_umap', 'X_umap_source'
    varm: 'PCs'
    layers: 'X_raw_counts'
Set the parameters#
layer_to_use = "X_pca"  # Representations of cells to use for sample representation. Must be in .obsm or layers
sample_id_col = "scRNASeq_sample_ID"  # Where sample or patient identificators are stored in .obs
cell_type_key = "Annotation_major_subset"  # Used for filtering of cells, but not necessary for most methods including pseudobulk
condition_col = "Outcome"  # A column in .obs that stores conditions of the samples
control_level = 6  # Value of condition_col to use as control. All others will be considered the case
Quality control of samples#
adata = patpy.pp.filter_small_samples(adata, sample_key=sample_id_col, sample_size_threshold=100)
0 samples removed:
Initialize the representation object#
pseudobulk = patpy.tl.Pseudobulk(sample_key=sample_id_col, cell_group_key=cell_type_key, layer=layer_to_use)
pseudobulk.prepare_anndata(adata)
Calculate a matrix of distances between samples#
distances = pseudobulk.calculate_distance_matrix()
distances
array([[0.        , 4.64685369, 8.5990148 , ..., 4.5335298 , 5.75458898,
        7.98608545],
       [4.64685369, 0.        , 6.21533269, ..., 6.09671616, 5.47561426,
        5.28739787],
       [8.5990148 , 6.21533269, 0.        , ..., 9.66443214, 7.75928943,
        4.24893086],
       ...,
       [4.5335298 , 6.09671616, 9.66443214, ..., 0.        , 6.25521014,
        9.3778456 ],
       [5.75458898, 5.47561426, 7.75928943, ..., 6.25521014, 0.        ,
        5.92739653],
       [7.98608545, 5.28739787, 4.24893086, ..., 9.3778456 , 5.92739653,
        0.        ]])
Run statistical test for the distances#
total_test_result = pseudobulk.evaluate_representation(
    target=condition_col,
    method="distances",
    control_level=control_level,
    normalization_type="total",
    compare_by_difference=True,
)
total_test_result
{'score': 1.4071983216304598,
 'p_value': 0.0,
 'metric': 'distances',
 'control_level': 6,
 'normalization_type': 'total',
 'compare_by_difference': True,
 'n_unique': 6,
 'n_observations': 113,
 'method': 'distances'}
shift_test_result = pseudobulk.evaluate_representation(
    target=condition_col,
    method="distances",
    control_level=control_level,
    normalization_type="shift",
    compare_by_difference=True,
)
shift_test_result
{'score': 0.7520475783097537,
 'p_value': 0.0,
 'metric': 'distances',
 'control_level': 6,
 'normalization_type': 'shift',
 'compare_by_difference': True,
 'n_unique': 6,
 'n_observations': 113,
 'method': 'distances'}
var_test_result = pseudobulk.evaluate_representation(
    target=condition_col,
    method="distances",
    control_level=control_level,
    normalization_type="var",
    compare_by_difference=True,
)
var_test_result
{'score': 1.368932888187764,
 'p_value': 0.0,
 'metric': 'distances',
 'control_level': 6,
 'normalization_type': 'var',
 'compare_by_difference': True,
 'n_unique': 6,
 'n_observations': 113,
 'method': 'distances'}
The interpretation of the results format#
score: difference (or ratio if
compare_by_difference==False) between the distances in comparison groups with correction for randomp_value: simulated p-value of the score
n_unique: number of unique values in
condition_col. Doesn’t really matter in this case, because they transformed to “case” and “control”n_observations: number of samples. Can be less than expected if for some samples value in
condition_colis missing
For the interpretation of different normalization types, please refer to the page 17 and figure 4 of Petukhov et al.
As we can see here, all 3 appoaches detect significant differences between cases and controls. That is, distances between cases and controls are significantly higher than within these groups. Additionally, variance within patients with diseases is significantly higher than between controls.
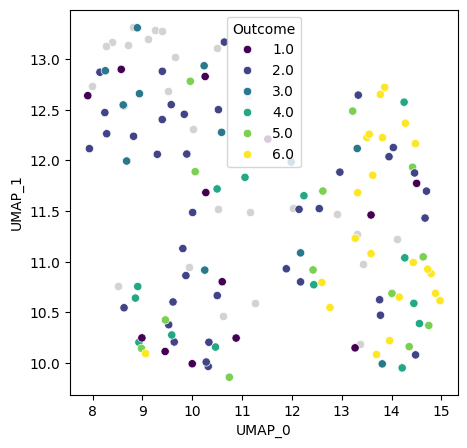
Plot embedding of the data for a sanity check#
pseudobulk.plot_embedding(metadata_cols=[condition_col])
<Axes: xlabel='UMAP_0', ylabel='UMAP_1'>